Creative Coding
A programming collection containing two P5.js projects.
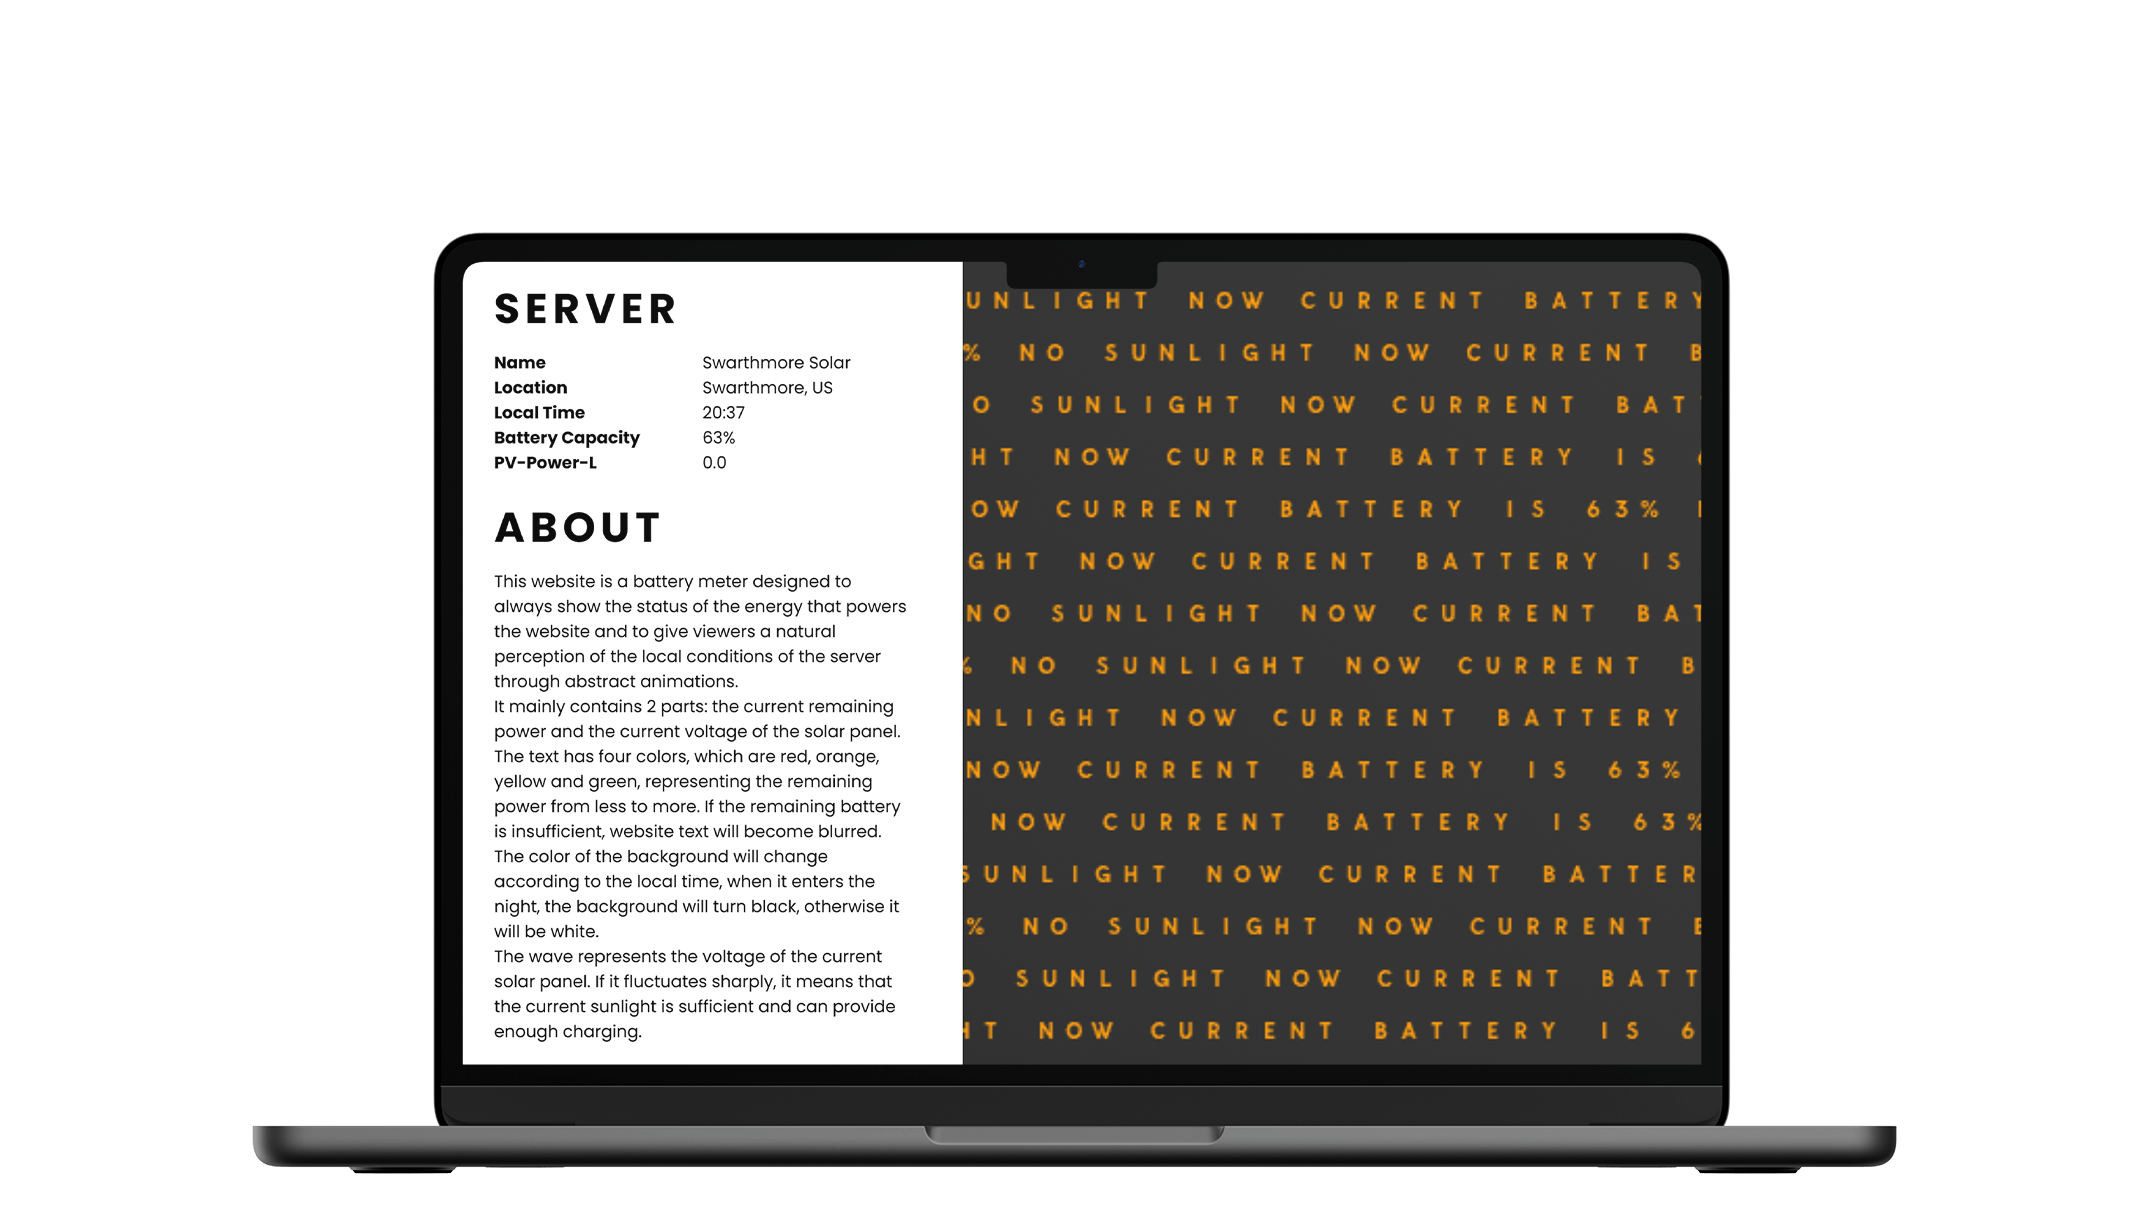
I.I This project uses an API from Solar Protocol to build a simple data visualization website.
—
I.II Inspired by the UX energy-centered design, the images on the website will change according to the current energy of the server, thus implying the status of solar energy.
I.III The instructions on the left side of the website inform the user of the current server status and how to interpret changes in the visualization.
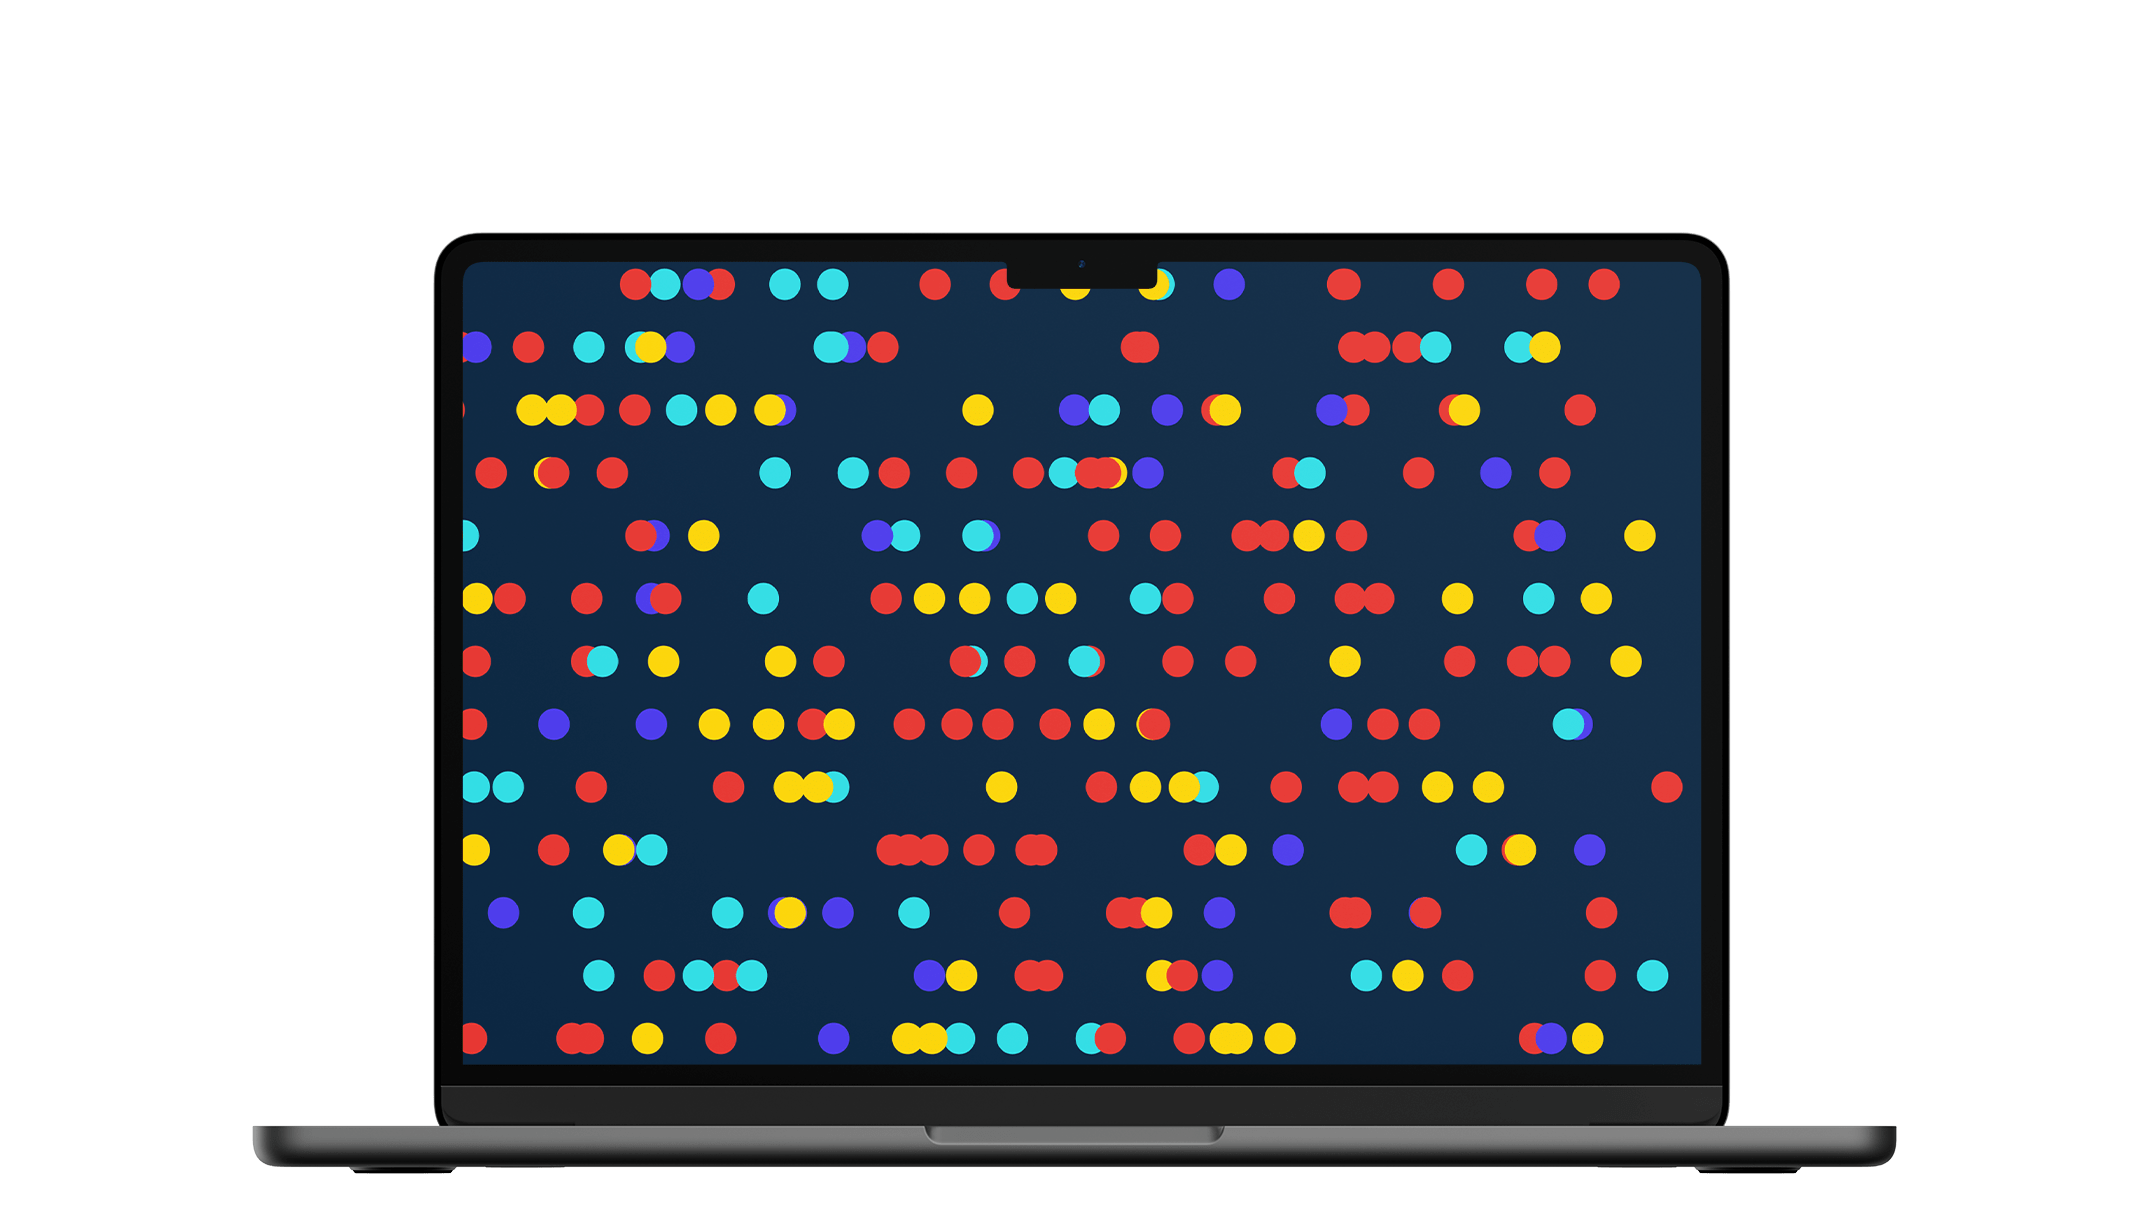
II.I This project is a data visualization attempt at the future possibilities of social media.
II.II Red, yellow, blue, and purple respectively represent the corresponding information content on social media: Bot, business, official, and user.
II.III Using the up and down keys to change the intervention, you can explore 3 different bad futures.