WIL Cube
Charts that can be touched and felt
About this project
WIL CUBE is a cube installation with a visual graphical theme. It is evaluated from the designer’s point of view in three different latitudes of workload, information and legibility: material touch (W), material fill height (I) and material sparsity (L). By observing, touching and feeling the state of the filled material provides options for the new data visualization designer.

At The Beginning
Our prototype comes from an attempt in the workshop, we made a simple device with simple materials. But we agreed that this prototype was very interesting and contained a lot of potential for expansion, so we decided to push ahead and see how far it could go.


Survey & Data
We think that evaluating commonly used charts from three different perspectives (readers, designers, and the data itself) can expand our understanding of different charts.
To this end, we developed questionnaires and conducted extensive data collection as the basis for the next steps.


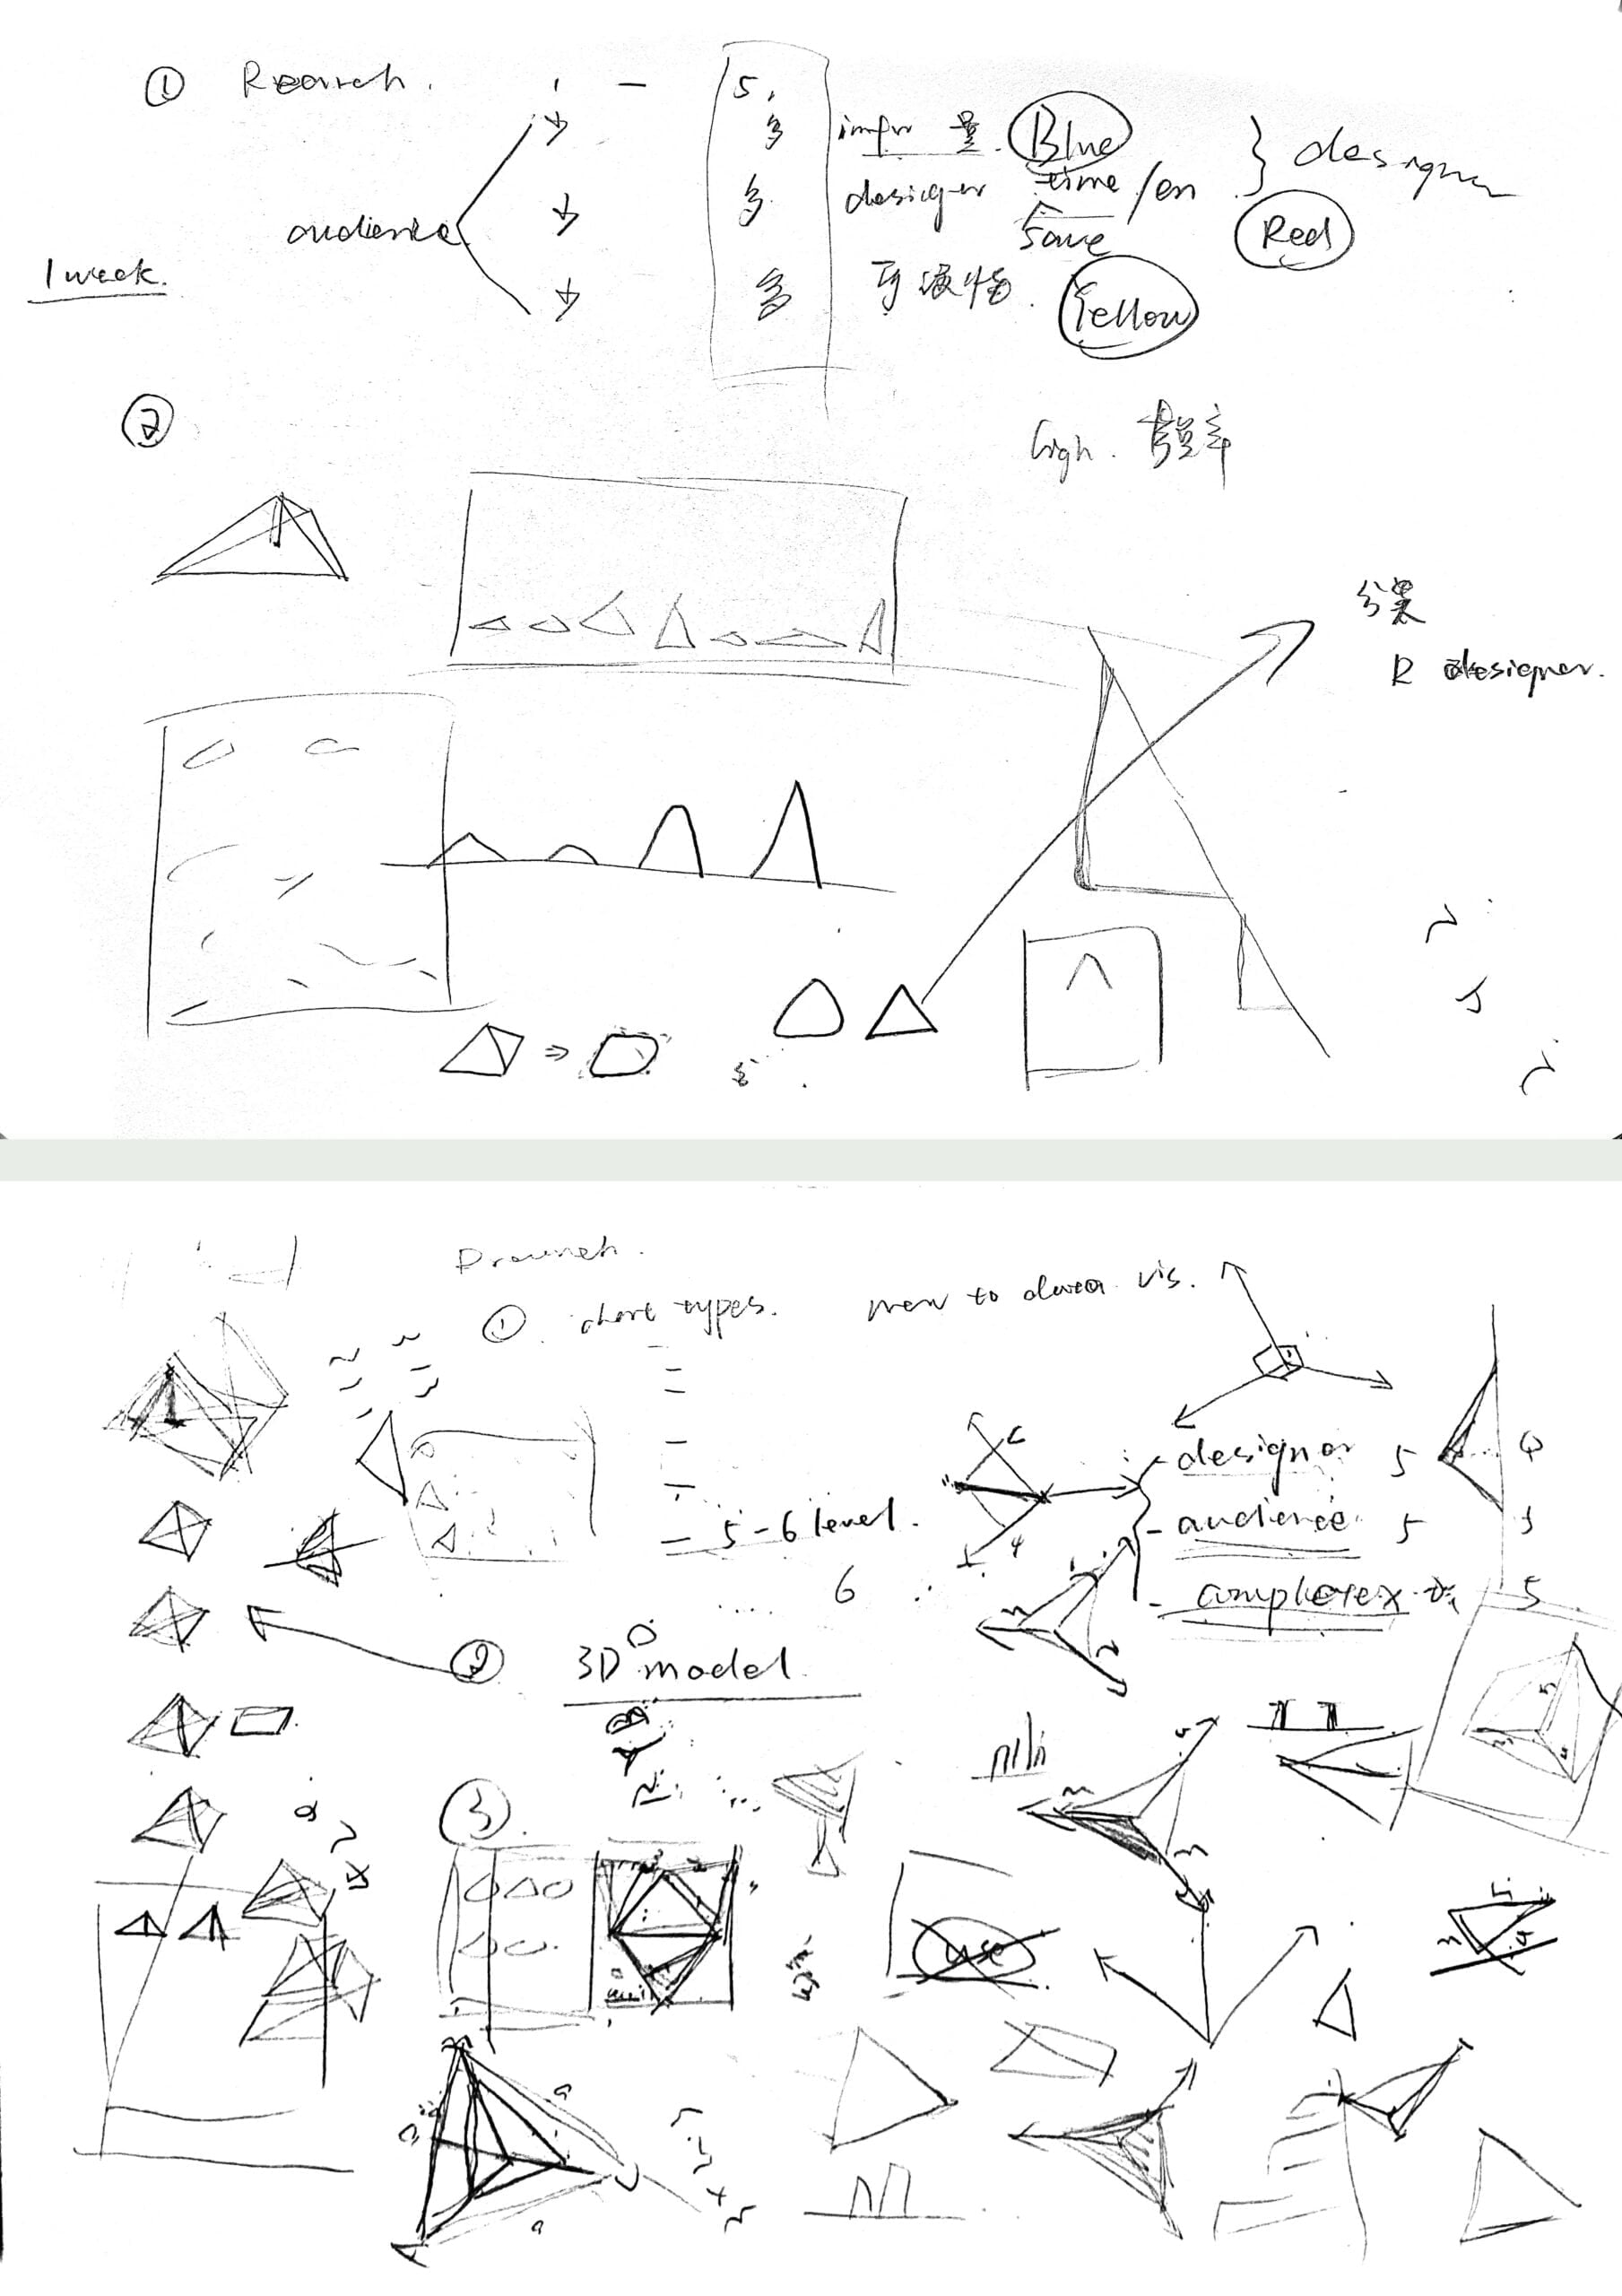
The First Development
We decided to use wood as the material and make our parts based on triangles. The material and plasticity of wood itself can allow the audience to connect the three properties of the diagram with the corresponding visual and tactile sensations.


The first outcome


The Second development
Based on the collected feedback and our previous experience, we have decided to further expand the presentation form of our installation art.
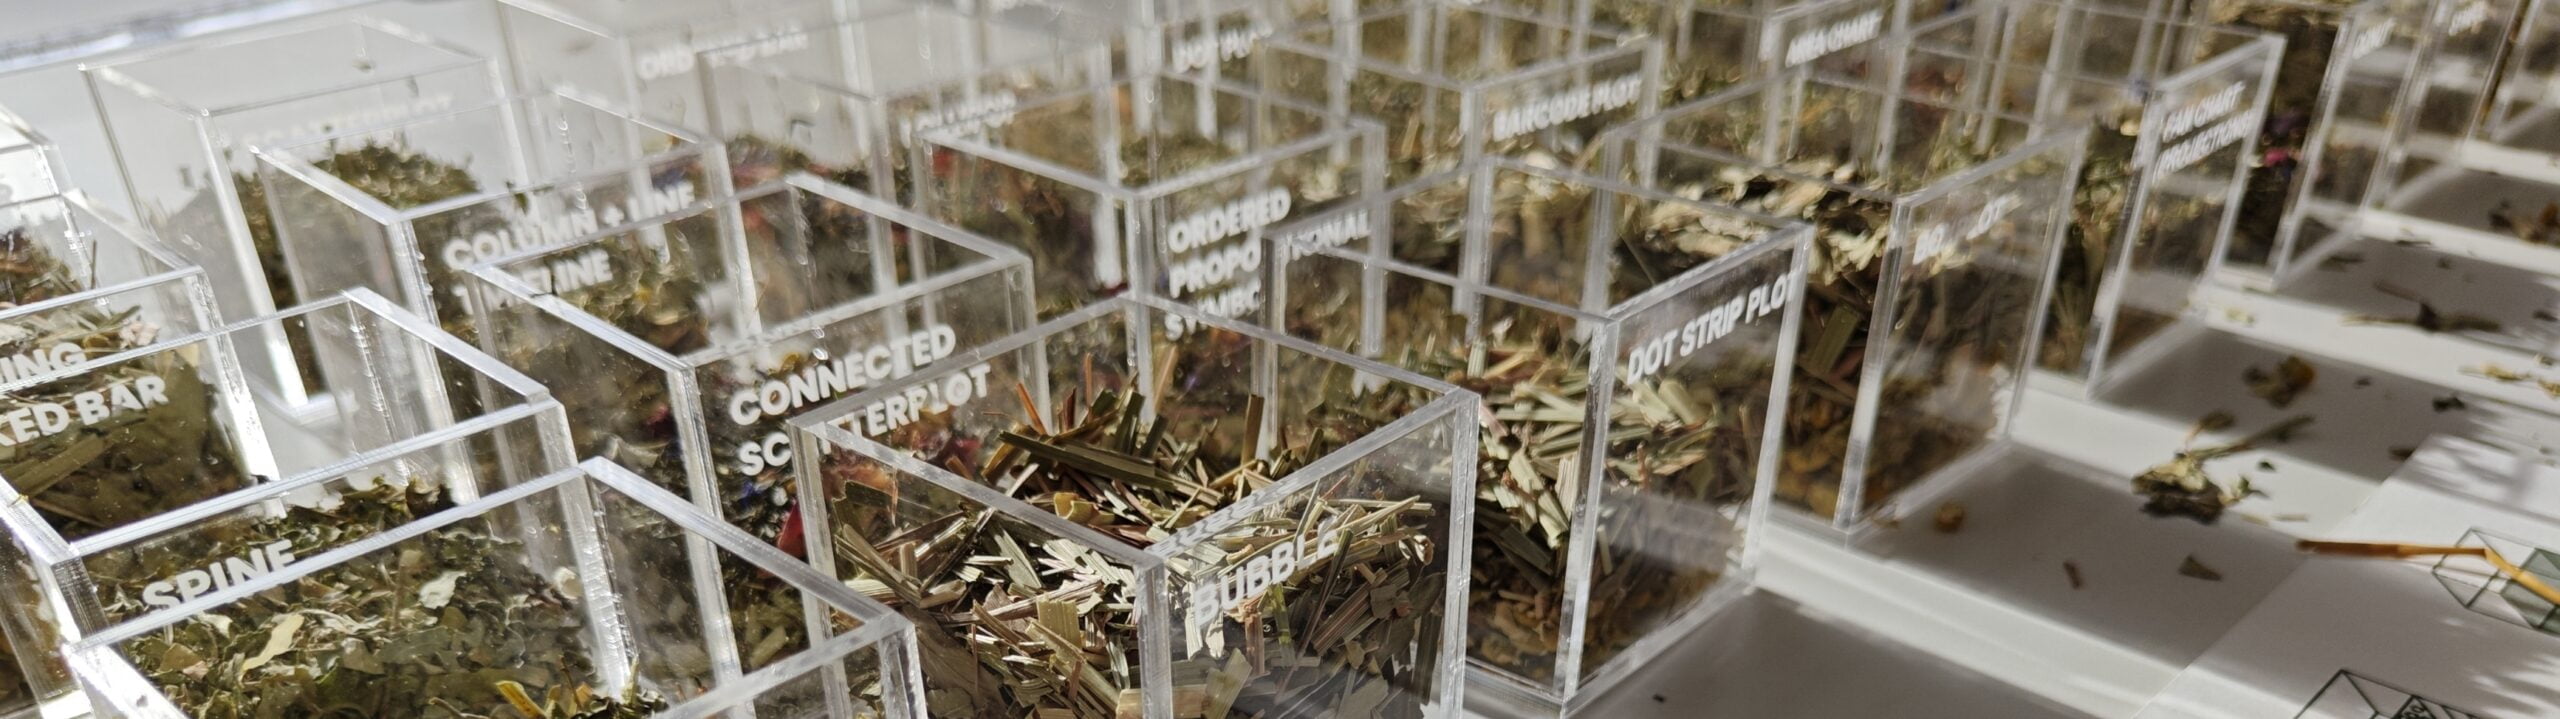
We have incorporated taste and smell in addition to touch, and replaced triangles with cubes. Tea and spices are used as filling materials for the plastic cubes, symbolizing the inherent connection between data and charts.


Outcome


